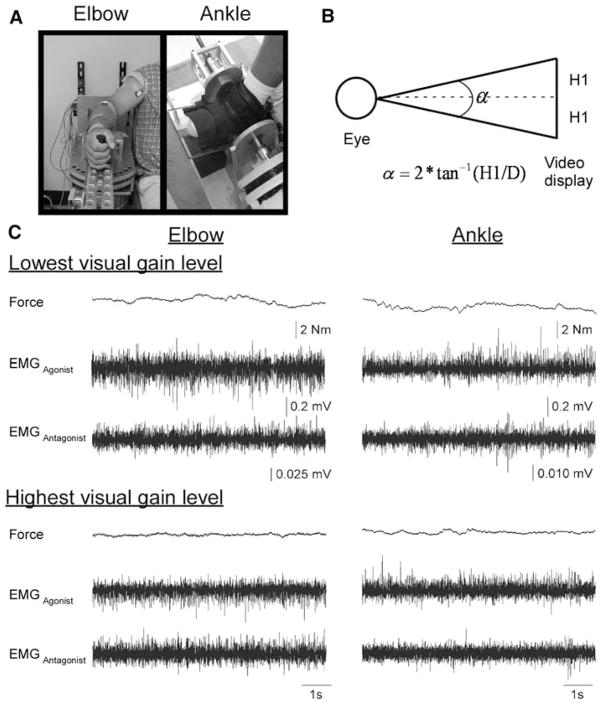
Fig. 1.
a The elbow and ankle manipulanda used for testing. b The calculation for visual gain where α is the visual gain (degrees), H1 is half the height of the force fluctuations viewed on the computer visual display (mm), and D is the distance from the eye to the video display monitor (held constant at 762 mm). c Force and EMG records from one trial at the lowest visual gain level (0.008°) and the highest visual gain level (1.95°) at the elbow (left panels) and the ankle (right panels) for one subject

