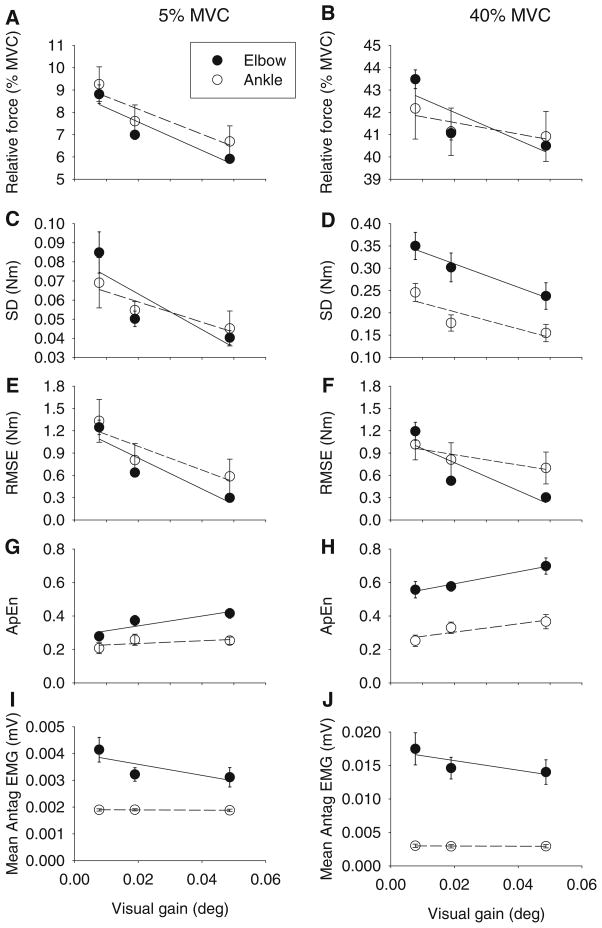
Fig. 3.
Linear regression applied to mean relative force (a, b), standard deviation of force (c, d), root mean square error of force output (e, f), approximate entropy (g, h) and mean antagonist EMG (i, j) across the three lowest visual gain levels (0.008°, 0.02°, and 0.05°), which showed significant results for the 5% MVC condition (left panels) and the 40% MVC condition (right panels). Data shown are the mean and standard error for the elbow (filled circles) and ankle (open circles). Parameters of the linear regression are provided in Table 2

