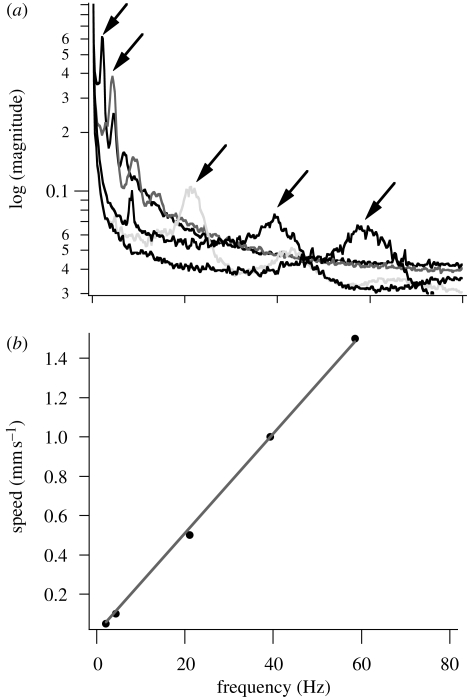
Figure 4.
Stick–slip frequency analysis of the GSA. (a) The averaged FFT magnitude from high-speed video shows dominant stick–slip frequencies that increase in proportion to velocity. The 0.05, 0.10, 0.50, 1.00 and 1.50 mm s−1 FFT traces are highlighted with arrows from left to right in increasing order. (b) The dominant stick–slip frequencies (arrows) varied linearly with speed as f = (25.3 µm)v. Using equation (4.4), the fit predicts a stick–slip displacement of λ = 25.3 µm.

