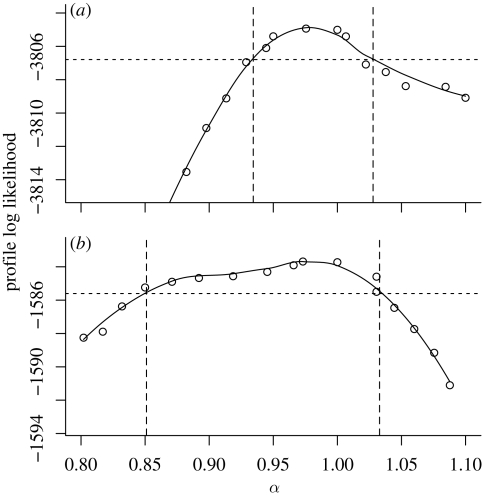
Figure 3.
Profile likelihood analysis of the mixing parameter, α, for (a) London and (b) Hastings. The solid black lines show the estimated profile log likelihood, derived from the Monte Carlo point estimates shown as circles. The dashed lines construct approximately 95 per cent CIs of (0.93, 1.03) for London and of (0.85, 1.03) for Hastings.

