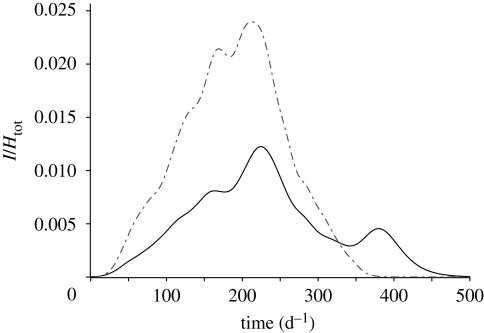
Figure 7.
Effects of population heterogeneity on the dynamics of an epidemic that spreads on an OCN construct. The two lines refer to the temporal evolution of the total number of infected normalized by the total population with uniform (dot-dashed line) and Zipf (solid line) population distribution. The total population and all the other parameters are the same in the two cases. The dynamical parameters employed are l = 1 d−1 and R0 = 3.

