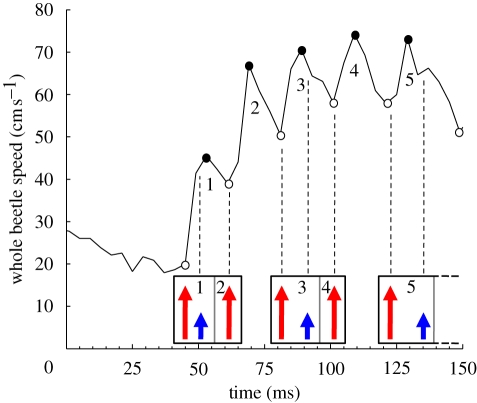
Figure 2.
Example of the whole-body speed of G. substriatus measured over time for type III leg kinematics. Small blue arrows represent the beginning of middle leg strokes and larger red arrows represent the beginning of hind leg strokes. Each numbered speed peak corresponds to a propulsion episode, with minima indicated by white circles and maxima by black circles. Rectangles identify the stroke patterns. Within a pattern, the stroke or strokes responsible for single propulsion episodes are separated by grey lines, with the number of the propulsion episode generated indicated. Min1 and Min2 correspond to the beginning of propulsion episode 1 and propulsion episode 2, respectively. Max1 indicates the maximum speed reached during propulsion episode 1. The difference in speed between Max1 and Min1 gives the gain of speed.

