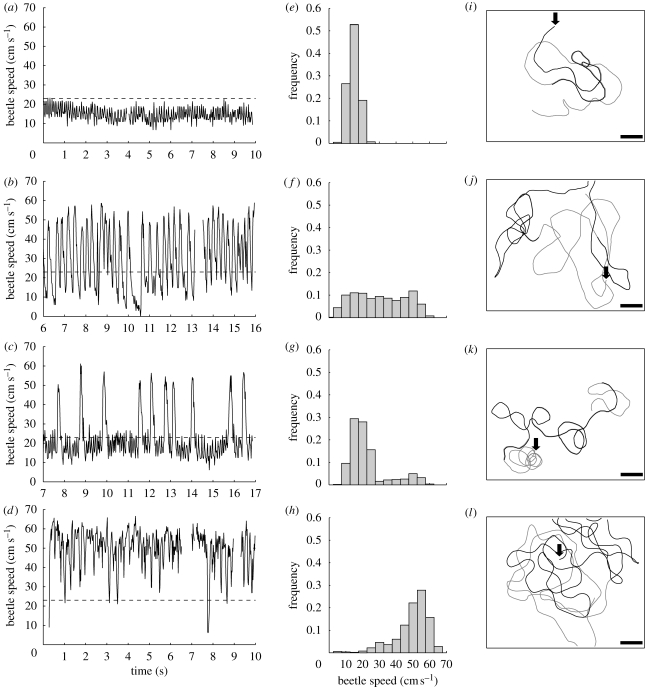
Figure 5.
Example of speeds and trajectories for the four main speed patterns observed for G. substriatus swimming on the water surface. Panels (a–d) show whole-beetle speed over time. The mean speeds of the sequences displayed in (a–d) are 14.74, 30.38, 22.80 and 49.75 cm s−1, respectively. The dashed line indicates a speed of 23 cm s−1, which is the minimum speed required for the generation of surface waves by the beetle's body. Panels (e–h) show the speed frequency histograms corresponding to the previous graphs. Panels (i–l) show the trajectories of the beetle, in black for the 10 s shown in the previous graphs, and in grey for the others 10 s analysed. The start of the trajectory is indicated by the black arrow and the scale bar represents 10 cm.

