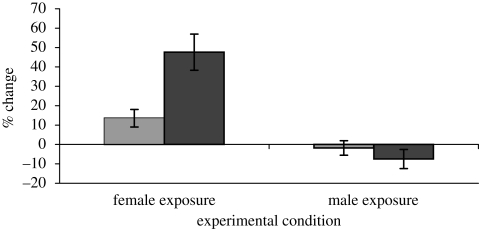
Figure 1.
Mean per cent change from baseline (±s.e.m.) for cortisol and testosterone concentrations within each experimental condition. Per cent changes in raw concentrations are depicted for presentation purposes, but statistics were performed on log-transformed values (see text). Light grey bars, testosterone; dark grey bars, cortisol.

