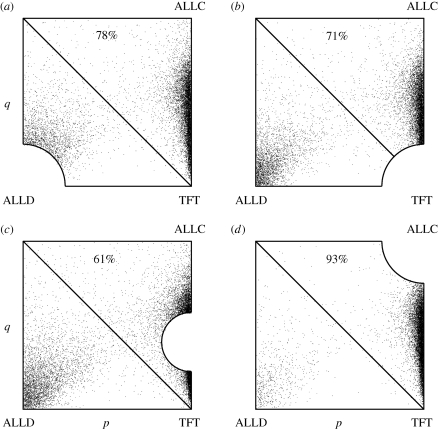
Figure 3.
Knock-out experiments. To understand the roles of individual strategies in the evolution of cooperation, we remove certain parts of the strategy space. (a) The point cloud shows the stationary distribution when mutations are drawn from the uniform distribution on all reactive strategies without those close to ALLD. The proportion of time spent in the cooperative half is 78%. (b,c) This proportion drops to 71% if TFT is knocked out instead and to 61% if GTFT with q = 0.4 is knocked out. The stationary distribution seems to try to concentrate mass close to the boundary of the removed disc. Here invasion is easier than in the disc, explaining the increase in defection. (d) Knocking out ALLC increases the proportion of cooperation to 93%. These experiments quantify the extent to which TFT and GTFT promote and ALLC hinders the evolution of cooperation. In (a), (b) and (d), the radius of the removed disc is 1/4, in (c), the radius is  , so that the removed areas coincide. The effect of removing strategies is similar but more pronounced if the discs are larger. For example, if a disc with radius 1/3 around ALLC is removed, then the proportion of cooperation increases to 97%. Parameter values are N = 100, b = 10 and c = 1.

