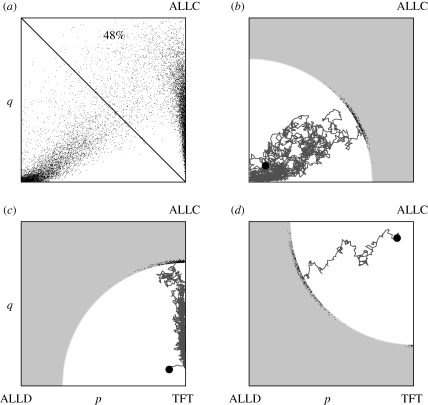
Figure 4.
Stochastic evolutionary dynamics with local mutation. In the local version of our stochastic evolutionary dynamics, mutations are drawn from a small neighbourhood around the resident strategy. In these simulations, we use a disc of diameter 0.05. (a) Stationary distribution and fraction of cooperation. As in the global mutation model, the process is most of the time either close to the TFT–ALLC edge or close to the ALLD corner, but the proportion of time spent in the cooperative half is considerably smaller. (b–d) Each panel shows one typical trajectory of the stochastic process starting from the big black point. The small points show the distribution of ‘hitting points’ where the process enters the grey area. They indicate the typical direction of evolutionary dynamics when starting from strategies near ALLD, TFT and ALLC, respectively. Parameter values are N = 100, b = 10 and c = 1.

