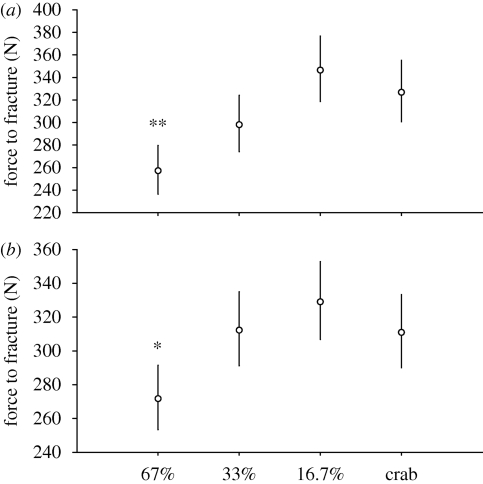
Figure 4.
Variation in force to fracture of N. lamellosa provided with high (67%), moderate (33%) and low (16.7%) food availability and high food availability while exposed to predator risk cues (crab). Values are back-transformed least-squares means and 95% confidence intervals of log-transformed data computed for (a) shell mass and (b) shell cross-sectional area at their means. Asterisks indicate groups that are significantly different from crab treatment (Dunnett's, *p < 0.05, **p < 0.01, ***p < 0.001).

