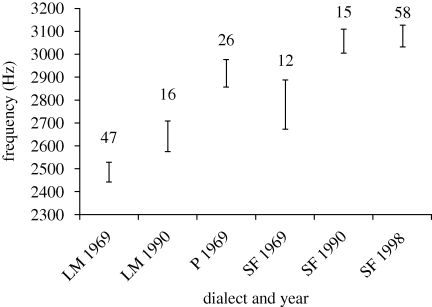
Figure 3.
Minimum frequency of songs from each dialect and the year that they were recorded. The top and bottom bars indicate the s.e. of the Lake Merced (LM), Presidio, (P) and San Francisco (SF) dialects in 1969/1970, 1990 and 1998. The values above the bars indicate the sample size for each dialect and year.

