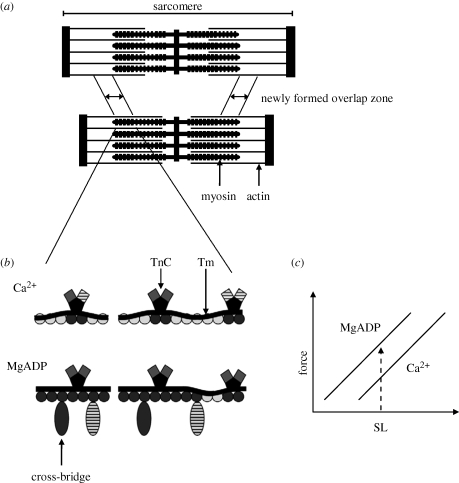
Figure 8.
(a) Diagram showing the overlap zone newly formed during shortening (Marechal & Plaghki 1979). When activated muscles (top) are shortened (bottom), the newly formed overlap zone inhibits cross-bridge attachment to actin, and thus the force is less than that produced during isometric contractions at the corresponding length. (b) A representation of one regulatory unit containing a thin filament with seven actin monomers and one Tm–TnC complex (left) (based on Gordon et al. 2000), along with the nearest-neighbour filaments (right)—all in the newly formed overlap zone after shortening. Hatched squares represent TnC units with bound Ca2+, moving the Tm away from the actin binding sites. Dark actin monomers (circles) are uncovered by Tm and exposed to cross-bridge binding and light actin monomers are not exposed to cross-bridge binding. With Ca2+ activation, the Tm in the newly overlap zone covers most of the actin-binding sites. With MgADP activation, cross-bridges are strongly bound to actin (dark oval), opening the possibility for new cross-bridges attachment to actin (hatched oval). (c) As a result of more cross-bridge attachment to actin, MgADP activation produces more force at a given SL when compared with Ca2+ activation, causing a leftward shift in the dynamic FL relation.

