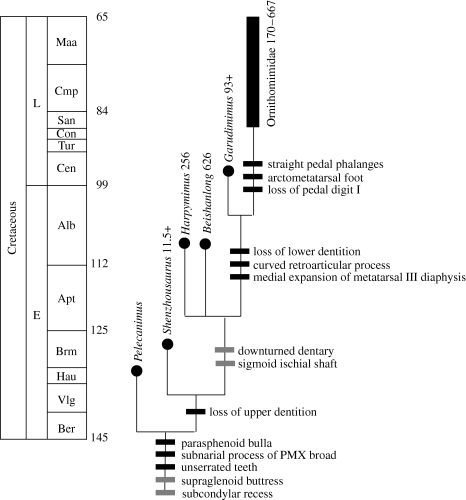
Figure 5.
Phylogeny of Ornithomimosauria excerpted from the strict consensus of the results of a larger analysis of 293 characters in 72 theropod taxa conducted with the program TNT (Goloboff et al. 2008; see the electronic supplementary material 2–5). Optimizations of select characters are indicated with black bars representing unambiguous synapomorphies, whereas those indicated in grey are ambiguous due to either missing data or unresolved relationships at adjacent nodes. Estimated body masses in kilograms (see text) are indicated next to terminals. Estimates suffixed with a ‘+’ are for taxa known from clearly subadult individuals and estimated masses are probably well below those for somatically mature individuals.

