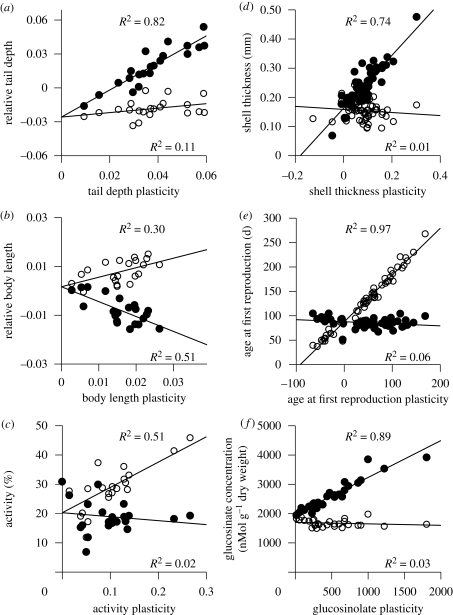
Figure 2.
The relationship between trait values and trait plasticities (i.e. the difference in trait values across environments) for several traits in three species; all data points are family means. In all cases, the most plastic families exhibit the most extreme trait values. (a–c) Traits of larval wood frogs (Rana sylvatica) reared with (closed symbols) or without (open symbols) predators (Relyea 2002; plotted trait values are size-independent residuals from the linear regression of log-transformed trait values against log-transformed mass). (d) A morphological defence of freshwater snails (Physa acuta) reared with (closed) or without (open) predator cues and (e) a life-history trait from the same species reared with (closed) and without (open) mates (J. R. Auld 2009, unpublished manuscript). (f) A chemical-defence trait of wild radishes (Raphanus raphanistrum) when reared with (closed) and without (open) herbivore damage (Agrawal et al. 2002). Correlations between trait values and trait plasticities are provided as r2 values within each environment.

