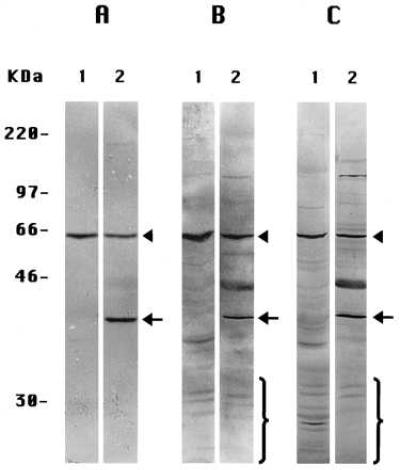
Figure 3.

Immunoblots of extracts of mouse liver (all lanes 1) and brain (all lanes 2) with anti-PS-1 antibody L3. (A) Specimens prepared by Method A-Tissues. (B) Method B-Tissues. (C) Method C-Tissues. Note the ≈40-kDa brain band in A, lane 2, also is present in B, lane 2, and C, lane 2. The arrowheads signify the intact monomeric PS-1 band; the arrows signify the brain-specific ≈40-kDa species; and the brackets signify some of the CTF endoproteolytic products of PS-1.
