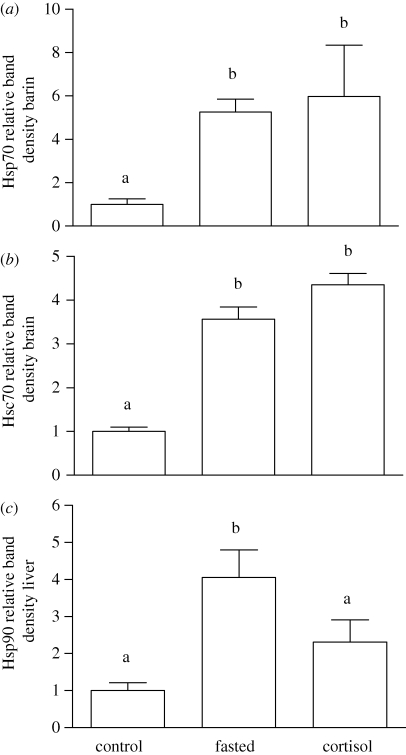
Figure 4.
Relative levels of brain (a) Hsp70, (b) Hsc70, and (c) liver Hsp90 in rainbow trout under control conditions (n = 9), or following fasting (n = 8) or treatment with a cortisol implant (110 mg kg−1; n = 6) for 5 days. Values are means ± 1 s.e.m. Bars that do not share a letter are significantly different from one another (one-way ANOVA and Tukey's post hoc test; p < 0.05).

