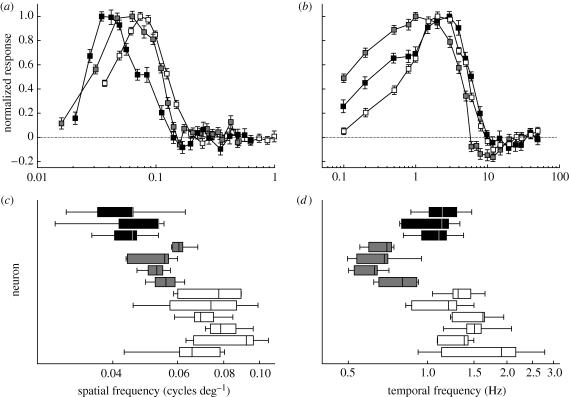
Figure 2.
Response tuning of wide-field motion-detecting neurons in each moth. Upper panels show the normalized responses of neurons to sinusoidal gratings at different spatial (a) and temporal (b) frequencies, with error bars showing the standard error of the mean. The normalization mapped the maximal mean response to 1, and the baseline response to 0. Temporal frequencies were tested at identical levels, but spatial frequencies varied slightly because the exact monitor distance changed somewhat between experiments. The non-hovering A. atropos was tuned to the lowest spatial frequencies, while crepuscular M. sexta was tuned to the highest. However, nocturnal hovering D. elpenor was tuned to lower temporal frequencies than the other moths. Lower panels show the ‘centre of mass’ spatial (c) and temporal (d) frequency of each neuron tested, calculated by averaging each frequency weighted by its relative response. Because centre of mass calculations weight the whole curve, their centres are not necessarily identical to the peaks of curves in the panels above (a, b). Each box shows the median and first and third quartiles, and whiskers show the range of the six trials for each neuron. Black: A. atropos; grey: D. elpenor; white: M. sexta.

