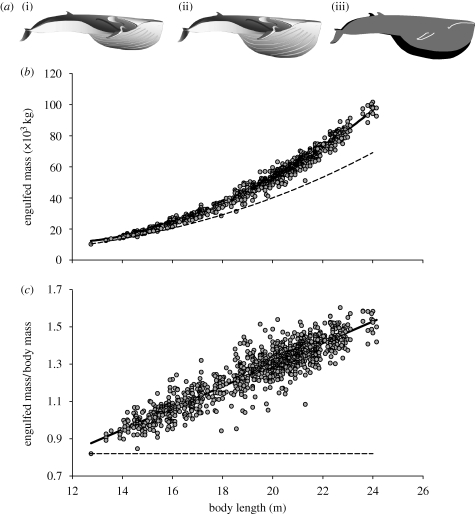
Figure 3.
Allometry of maximum engulfment capacity. (a) Schematics of maximally filled buccal cavities for (i) the smallest (12 m), (ii) the largest (24 m) fin whale in the dataset are scaled to one another, and (iii) the outlines of each are superimposed in order to show the relative changes in the tail and buccal cavity. Images modified from Goldbogen et al. (2007). (b) Engulfed mass is proportional to  (r2 = 0.99). If engulfed mass were isometric, it would follow the dashed line. (c) Engulfed mass relative to body mass increased with body length as
  (r2 = 0.85). The dashed line represents isometry.

