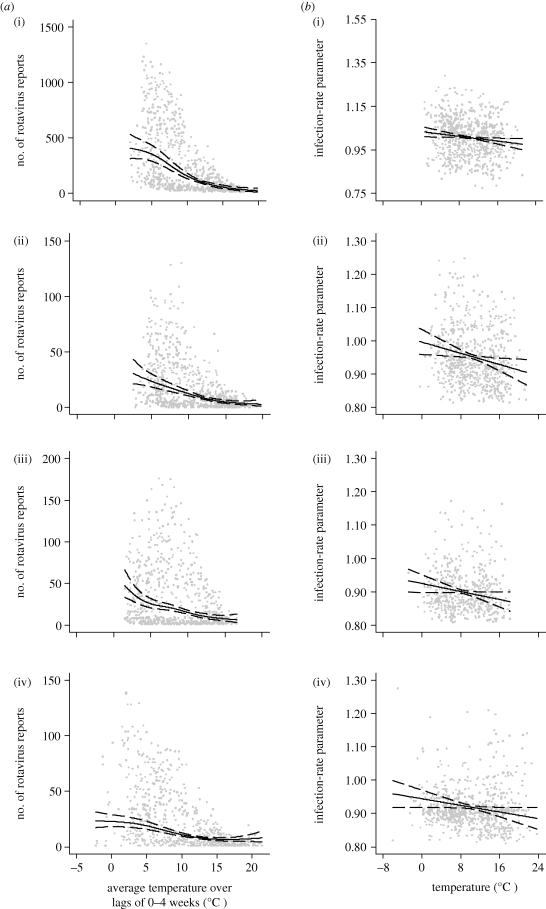
Figure 2.
Scatter plot of (a) reported rotavirus infections and average weekly temperatures over lags of 0–4 weeks and (b) the infection-rate parameter and average weekly temperature. The centre line is the estimated natural cubic spline (4 d.f), and the upper and lower lines represent the 95% CI. (i) England (aggregated across the nine regions), (ii) Wales, (iii) Scotland and (iv) The Netherlands, 1993–2007.

