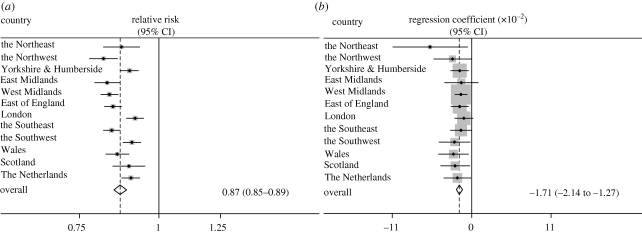
Figure 4.
Forrest plot with fixed effects summary estimate for (a) a 1°C increase in mean weekly temperature above a threshold of 5°C on reported rotavirus infections and (b) a 1°C increase in mean weekly temperature on the infection-rate parameter across the whole temperature range. England, Wales, Scotland and The Netherlands, 1993–2007.

