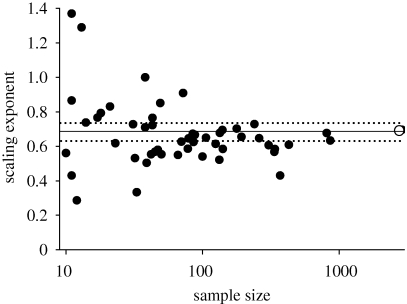
Figure 2.
Relationship between the scaling exponent (the RMA slope) of the NL–PL relationship and the sample size, for 50 angiosperm orders (closed circles). The mean (0.667) and 95% CI for the scaling exponent are shown in the solid and dashed lines. The mean for the gymnosperm order ‘Pinales’ is shown in the open circle for comparison.

