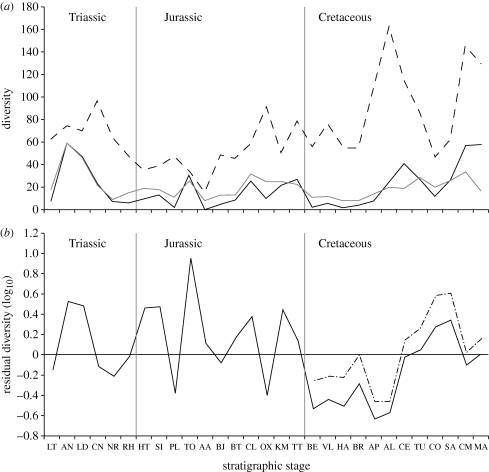
Figure 2.
Plots of diversity and FMFs through time. (a) Uncorrected (raw) data. (b) Residual data after correction for a model in which FMF predicts diversity (see text for an explanation). Dashed line shows FMF, black line shows TDE, grey line shows PDE and dashed-dot line shows TDE corrected for a model based solely on Cretaceous data.

