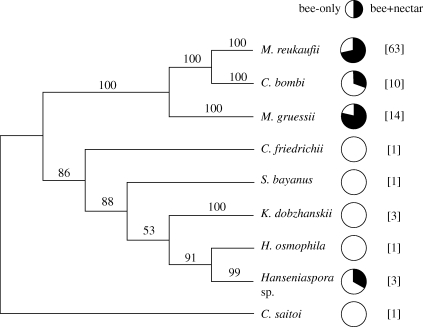
Figure 2.
Phylogenetic tree summarizing the evolutionary relationships between the nine yeast species identified in this study, obtained by the Bayesian inference analysis of DNA sequence data from individual isolates. The simplified tree and Bayesian clade credibility (posterior probability) values presented here were generated by culling taxa from the larger phylogram depicting the relationships between the 97 isolates from the two experimental groups combined, shown in the electronic supplementary material, appendix. Clade credibility values, expressed as percentages, are shown next to the branches (are missing from branches represented by single isolates). Pie charts denote the proportion of isolates of each species in the bee-only (open sectors) and bee + nectar (filled sectors) experimental treatments. Total numbers of isolates per species are shown in brackets (see also table 1).

