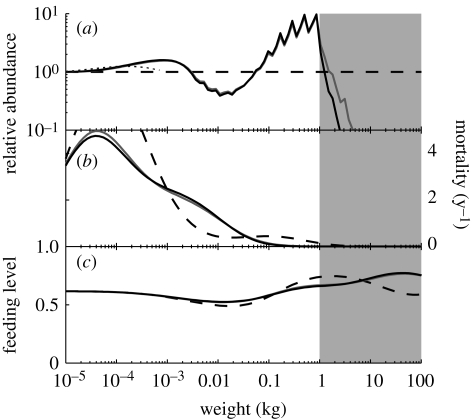
Figure 3.
The unexploited system from figure 2 (dashed lines) compared to systems with fishing mortality on fish larger than 1 kg (grey patches). Fishing mortality is 0.5 yr−1 (grey line) and 1 yr−1 (black line). (a) Abundance in the fished spectrum relative to abundance in the unexploited spectrum Nc(F)/Nc(F = 0) for fish (solid lines) and resource (dotted lines), (b) predation mortality and (c) feeding level.

