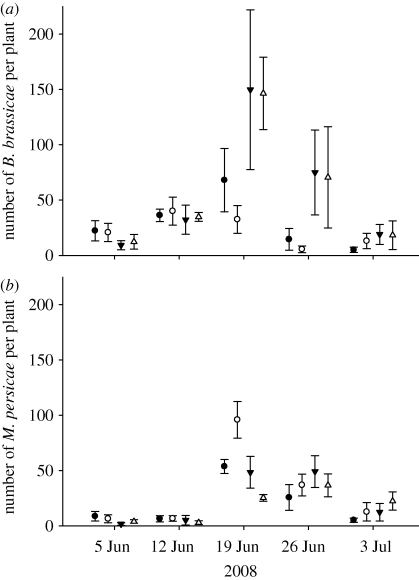
Figure 1.
Mean (± standard error) number of (a) B. brassicae and (b) M. persicae per B. oleracea plant growing in conventional high nitrogen (filled circle), conventional low nitrogen (open circle), organic high fertilizer (filled down triangle) and organic low input (open triangle) field trial treatments in 2008. Results from 2007 are not shown as aphid populations were very low (maximum M. persicae per plant = 39), and there were no significant differences between the organic and conventional treatments for either species in 2007.

