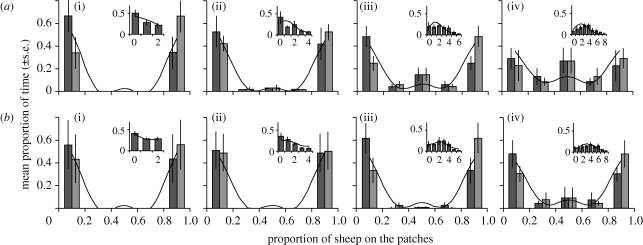
Figure 2.
Collective behaviours: experimental (grey bars: mean ± s.e.) and simulated (black lines) frequency distributions of sheep across the patches for groups of two, four, six and eight animals and for bold and shy groups. Dark and light grey bars represent the right and left patches. The insets indicate the experimental (grey bars: mean ± s.e.) and simulated (black lines) frequency distribution of the different numbers of sheep on the background in each case. (a) Bold sheep: (i) group size 2, (ii) 4, (iii) 6, and (iv) 8. (b) Shy sheep: (i) group size 2, (ii) 4, (iii) 6, and (iv) 8.

