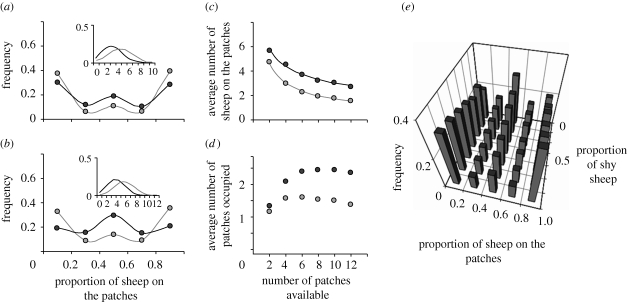
Figure 3.
Model properties: (a,b) show predictions of the model for groups of 10 and 12 sheep, respectively, confronted with two patches. Dark and light grey circles represent the simulated frequency distribution for the proportions of sheep on patches for bold and shy groups, respectively. The insets indicate the frequency distribution of different numbers of sheep on the background in each case (black and grey lines for bold and shy groups, respectively); (c,d) show model predictions for the distribution of sheep across patches for simulated groups of eight bold (dark grey circles) or shy (light grey circles) individuals confronted with an increasing number of patches, when the total patch area is kept constant; (c) shows that the average number of sheep located on the patches at any time decreases as the square root of the number of patches, with black and grey lines showing fitted values for bold (y = 7.8x−0.4, r2 = 0.99) and shy (y = 7.1x−0.6, r2 = 0.99) simulated groups; (d) shows the average number of patches that contain sheep at any time as patch number increases; and (e) shows predicted frequency distributions of the proportion of sheep on the patches, for simulated mixed groups of 12 individuals, as a function of the proportion of shy sheep in the group.

