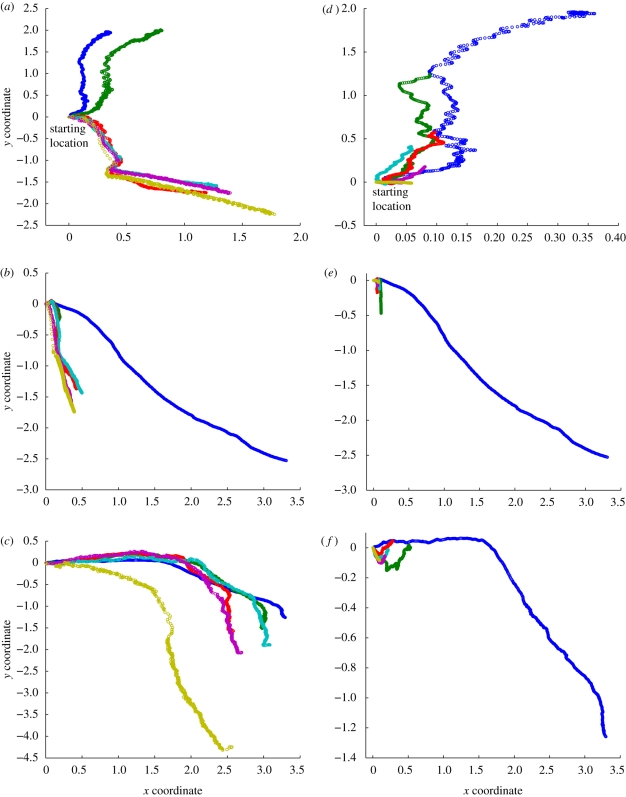
Figure 5.
Gait trajectories showing the travel of the centre of mass over the x/y coordinate frame for faster (a–c) and slower (d–f) gait speeds for three evolved gaits (each row). As the speed of the evolved gait changes, both the distance travelled and the path traversed vary significantly. Left- and right-hand figures are not on matched scales. Any increase in distance travelled (slower gaits in left hand figure) is due to the significantly longer amount of simulator time required for the structure to complete a fixed gait cycle. At this time scale, factors such as momentum play a larger role. Blue, full; green, 2 times; red, 3 times; turquoise, 4 times; purple, 5 times; yellow, 20 times.

