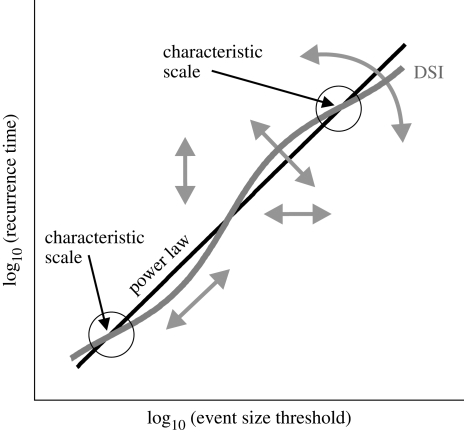
Figure 2.
DSI (grey line) modulates a power law probability distribution (black straight line, log–log scale); intersections of the modulation with lesser slope than the power law (circled) identify characteristic scales. Changes in DSI parameter values comprise power law intercept and slope, and phase, amplitude and frequency of the superposed modulation (arrows).

