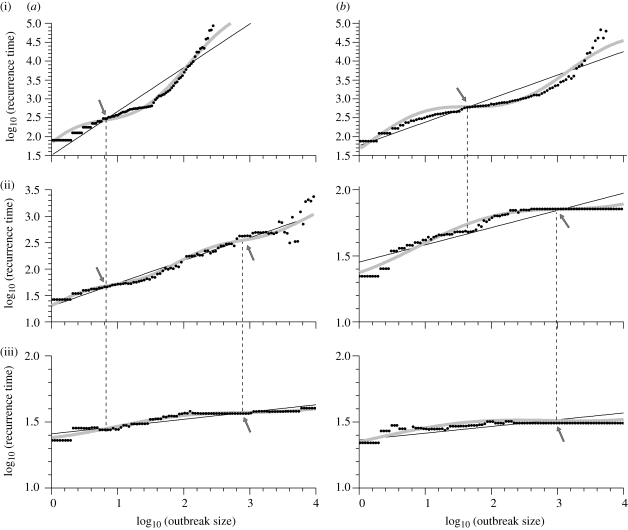
Figure 3.
DSI profiles for the British poultry industry network on a log–log scale of minimum outbreak size (initial seeding excluded) versus its typical recurrence time. The best-fitting DSI modulation (grey) is superposed on the pure power law (straight line); black dots represent imposed thresholds in outbreak size; arrows mark characteristic scales for (a) EU and (b) BC controls with (i) normal, (ii) HI and (iii) XT transmissibilities. (a(iii),b(iii)) Smaller power law slopes greatly increase the likelihood of large outbreaks. Dashed vertical lines highlight the continuity of characteristic scales between the three panels of each control strategy. Aspect ratios adjusted for clarity.

