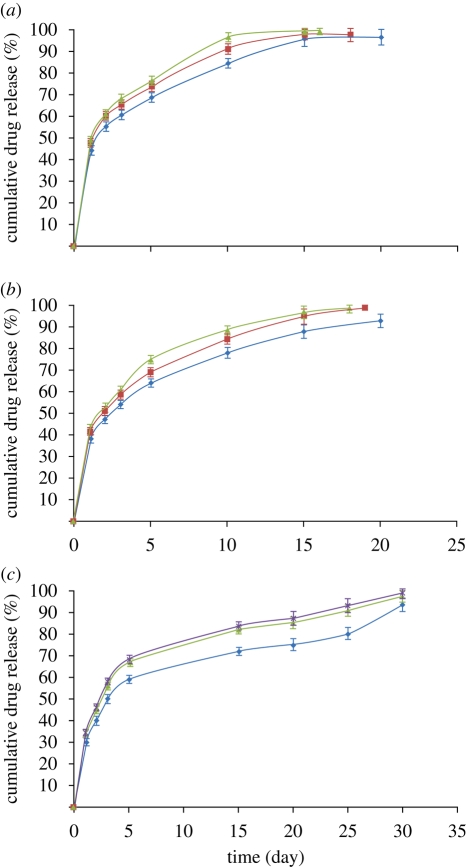
Figure 7.
Oestradiol release profile for PLGA particles following exposure to ultrasound (15 and 30 s). (a) PLGA : DMAC 2 : 98 (blue diamond, PLGA 2 wt%; red square, PLGA 2 wt% + 15 s US; green triangle, PLGA 2 wt% + 30 s US), (b) PLGA : DMAC 5 : 95 (blue diamond, PLGA 5 wt%; red square, PLGA 5 wt% + 15 s US; green triangle, PLGA 5 wt% + 30 s US) and (c) PLGA : DMAC 10 : 90 (blue diamond, PLGA 10 wt%; red square, PLGA 10 wt% + 15 s US; green triangle, PLGA 10 wt% + 30 s US). US, ultrasound.

