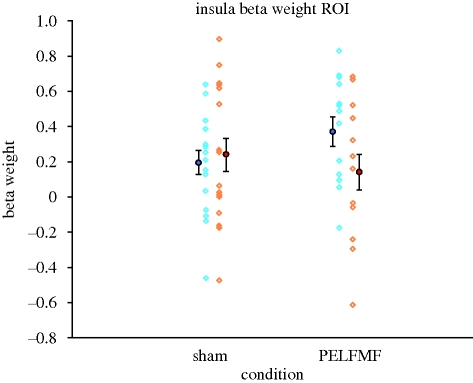
Figure 5.
Beta weights from ipsilateral insula. The means before (large blue circle) and after (large red circle) sham or pulsed magnetic field exposure (PELFMF) are plotted, with error bars as ±s.e.m. There is a relative decrease following PELFMF exposure, giving rise to a significant interaction. Individual beta scores are plotted as faint open symbols for pre- (blue) and post-exposure (orange) to demonstrate the range of individual variability. The other interactions found likewise appear to be driven largely by a decrease in the activity following PELFMF exposure.

