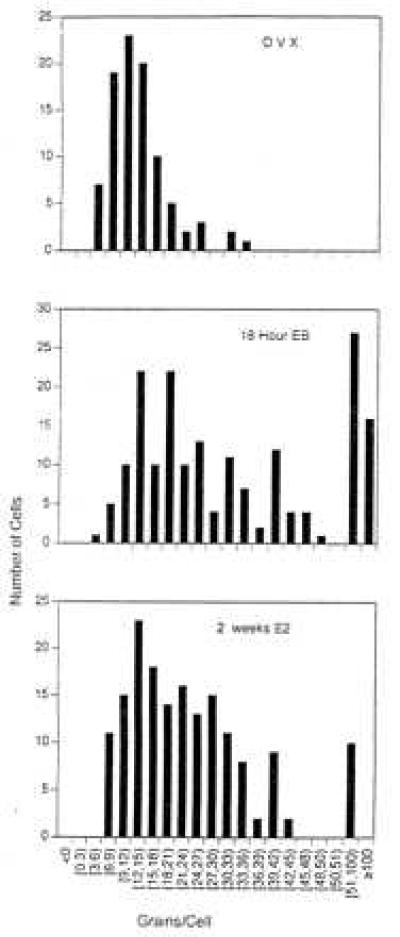
Figure 3.

Histograms showing the distribution of labeled cells in the VMN of control OVX rats (Top), OVX rats treated with E for 18 hr (Middle) or 2 weeks (Bottom). Data are pooled from five animals per group. The highly labeled (51-100 grains per cell) and very highly labeled (>100 grains per cell) classifications are estimates as the grains could not be counted accurately in these cells. All quantification was carried out without knowledge of the treatment group. The shape of the 18 hr and 2 week distributions are significantly different from the OVX group (P < 0.01, Kolmogorov–Smirnov analysis).
