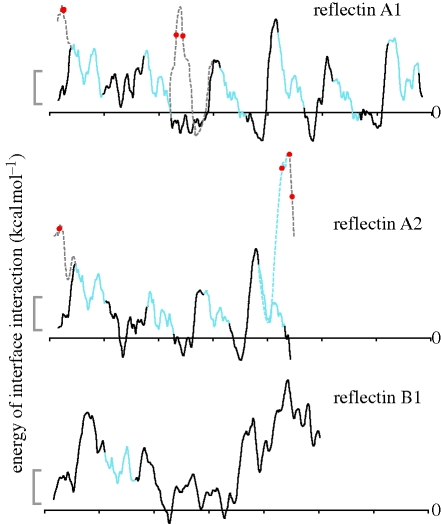
Figure 5.
Interface affinity of reflectin proteins. Traces indicate the calculated energy of interface interaction between a hypothetical membrane surface and 13-residue ‘windows’ of the reflectin proteins as a function of position in the proteins. Values are calculated by the method of Jaysinghe et al. (2006). Grey scale bar shows 2 kcal mol−1; negative values indicate regions of potential membrane association, while positive values indicate regions predicted to be cytosolic. Blue regions are the conserved ‘reflectin motifs’. Black regions are the intervening non-conserved regions. Dashed lines show the hypothesized interface interaction energy after phosphorylation. Red dots indicate residues phosphorylated concomitant with the activation of iridescence by ACh. When a residue becomes phosphorylated, the surrounding regions of the protein are predicted to shift from being membrane-associated to cytosolic. Sites of phosphorylation in reflectin 2B have not yet been identified.

