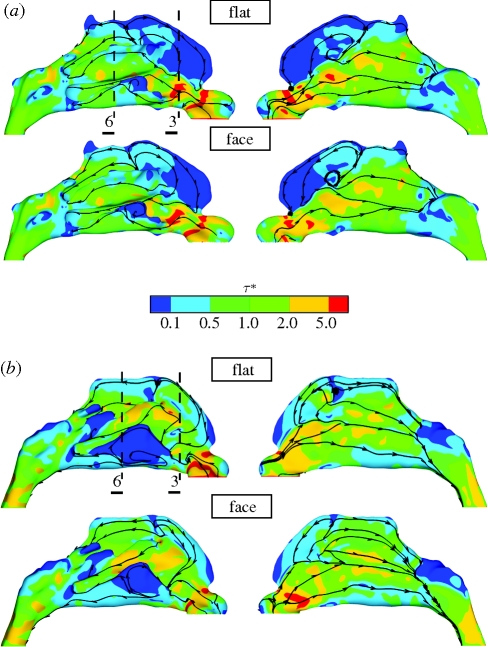
Figure 3.
Contours of the magnitude of WSS (WSS − τ*), normalized by the mean WSS magnitude (table 4) as viewed from each side, are shown for (a) subject A and (b) subject B. The simulations for a flat velocity profile at the nostril (top of a and b) and including the external face (bottom of a and b) correlate strongly, though noticeable differences occur in the region of the olfactory cleft and inferior meatus. Surface streamlines of WSS (i.e. streamlines following the WSS vector along the nasal boundary) indicate the underlying flow direction and patterns; note the stagnation of the inspiratory jet in the roof of the cavity, the large anterior recirculation region forward of this and above the jet issuing from the nasal valve. Transverse WSS streamlines adjacent to the nasal valve of subject B depict the detachment of the jet issuing from the nasal valve from the lateral wall of the nasal passageway. Broken lines denote the locations of slices (3 and 6) referred to in figures 1 and 4.

