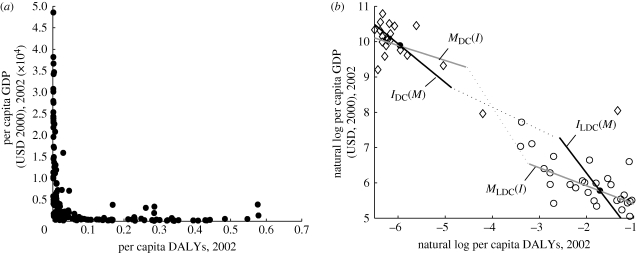
Figure 4.
Disease burden and income. (a) The correlation between per capita GDP (USD, 2000) in 2002 and the infectious disease burden (DALYs) in 2002 over 170 countries in the world is negative and highly nonlinear. (b) The natural log of the per capita DALYs and GDP are presented for least developed countries (LDCs, open circles) and developed countries (DCs, open diamonds) with the filled circles representing the average values for the LDCs and DCs. The slopes of the estimated effect of income on disease burden, IDC(M) and ILDC(M), and of disease burden on income, MDC(I) and MLDC(I), are represented by the solid lines. If the estimates of the stable equilibria are part of a continuous system, then there is an unstable equilibrium in-between, represented by the dotted lines. Data sources: Lopez et al. (2006); World Bank Development Data Group (2007).

