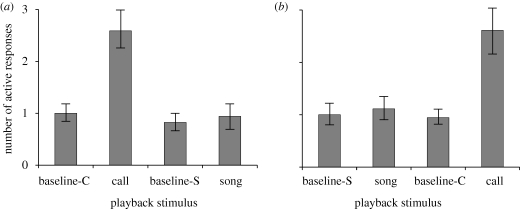
Figure 1.
Mean number of active-response-exhibiting Madagascan spiny-tailed iguanas in each baseline and playback period. (a) Experiment in which alarm call was played back first and song second. (b) Experiment in which song was played back first and alarm call second. Baseline-C and baseline-S indicate periods preceding alarm call playback and song playback periods, respectively. Error bars represent 1 s.e. See text for detailed descriptions of active responses.

