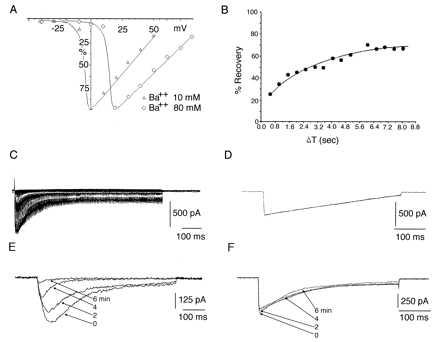
Figure 5.

α1A, α2δ, βIb currents characteristic features. (A) Comparison of I–V relations of α1A, α2δ, βIb currents in 10 (▵) and 80 (○) mM barium. (B) Time course of recovery from inactivation of currents expressed by α1A, α2δ, βIb cDNAs. The currents were obtained during pairs of depolarizing pulses to +10 mV separated by intervals at −100 mV of increasing duration. The first interval was 40 msec and increments of 40 msec up to 8 sec. Recovery current is plotted as a function of time. (C) α1A, α2δ, βIb currents elicited by pulses to +60 mV from a holding potential of −90 mV. The pulse duration is incremented at 2 msec steps and delivered every 15 sec up to a maximum duration of 750 msec. This sequence generates a curve with an inactivation τ similar to the one observed with a single pulse to +10 mV and 500-msec duration in the same cell (D) Evidence of calcium-induced calcium current inhibition in currents generated by α1A, α2δ, βIb cDNAs. (E) Recordings of calcium currents (see Material and Methods) elicited by a depolarization to +10 mV from Vh = −90 mV delivered every 30 sec. Shown are currents obtained at control (0), 2, 4 and 6 min. (F) Same protocol and combination of cDNAs as in E but in 10 mM extracellular barium. The contrast of current stability between E and F is dramatic.
