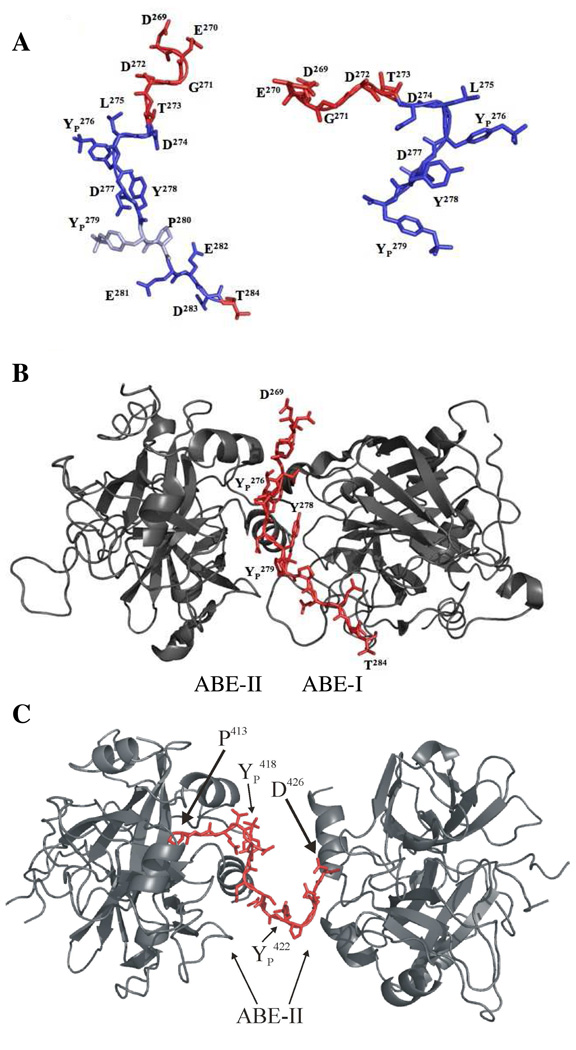
Figure 11.
A. Representation of the GpIbα peptide isolated from thrombin. The peptide on the left is from 1OOK and the structure on the right is from 1P8V. The individual amino acids are labeled. The trans bond between YP 279-P280 in 1OOK is in light blue. Residues experiencing line-broadening in the 1D NMR spectra are in blue. B. Illustration of GpIbα peptide induced dimerization of thrombin in 1OOK. The data suggests this structure more accurately represents the NMR results. The C-terminus of GpIbα is in an extended conformation and residues D274-T284 interact with both ABE-II and ABE-I of opposing thrombin monomers. C. Illustration of γ′ peptide induced dimerization of IIa depicted in the structure 2HWL. The turn conformation is situated between the two symmetry related IIa monomers, both at ABE-II. These figures were created using PyMol (11).

