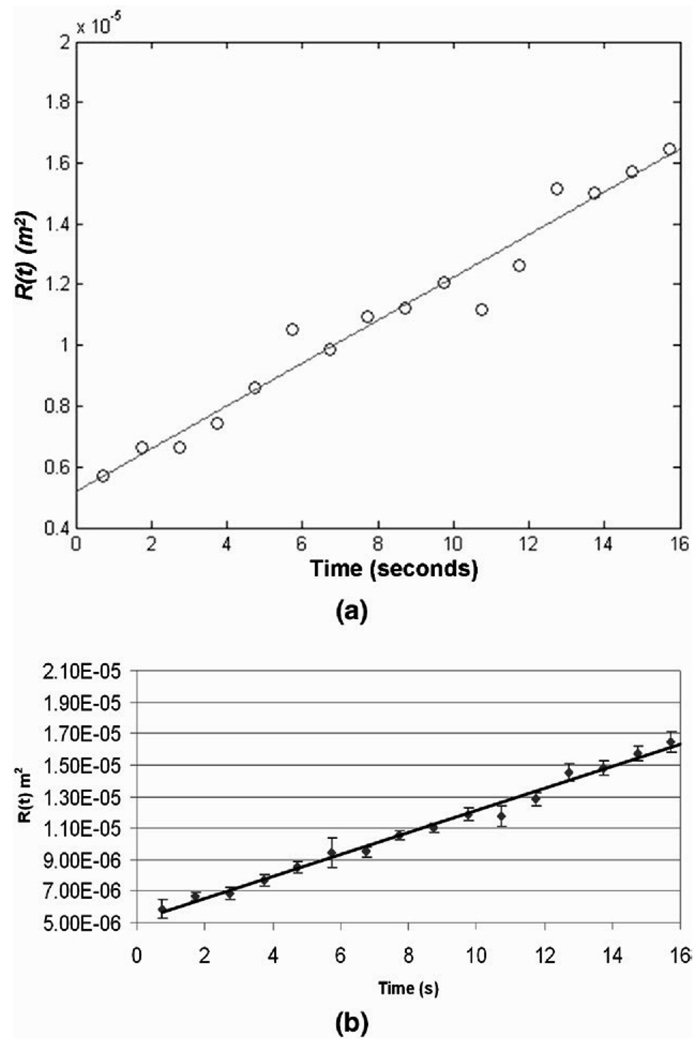
Fig. 7.
(a) Plot of R(t) versus time t estimated from a RF data set acquired in the alginate phantom. The straight line represents a least squares linear fit to the data points. (b) Plot of the mean value of R(t) versus t from data collected in five independent phantom samples. The error bars represent the standard deviation in R(t).

