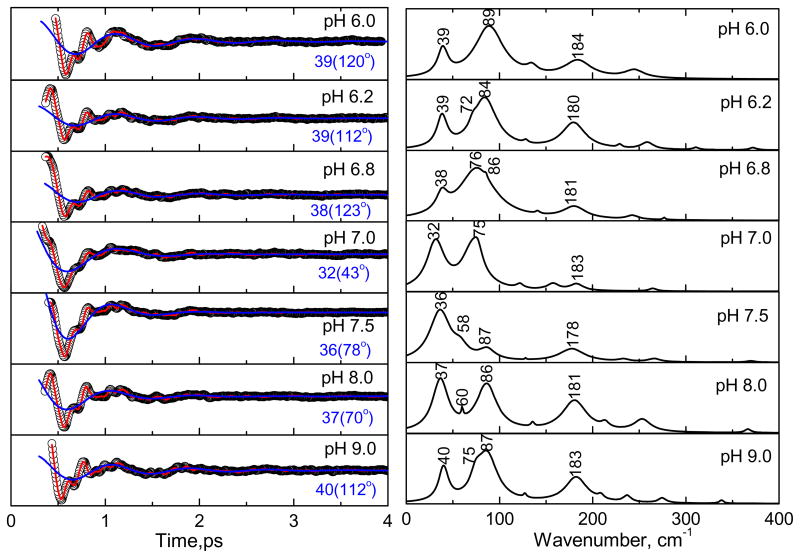
Figure 8.
The open-band coherence spectra of the ferric state of CBS at different pH (as in Fig. 6). The pump/probe excitation wavelength is at 425 nm. The left panels show the oscillatory components (circle) and the LPSVD fits (solid red line). The LPSVD component corresponding to the strong γa mode at ~40 cm−1 and the phase is also shown (blue solid line). The right panels show the corresponding amplitude of the power spectra. At pH 8 and 9, the modes at ~40 cm−1 (γa) and ~90 cm−1 (γc) are seen to dominate. When the pH is decreased to ~ 7, a mode at ~75 cm−1 (γb) appears and the mode at 90 cm−1 minimizes or disappears. A further decrease of pH to 6, reveals again the strong modes at ~40 cm−1 (γa) and ~90 cm−1 (γc).

