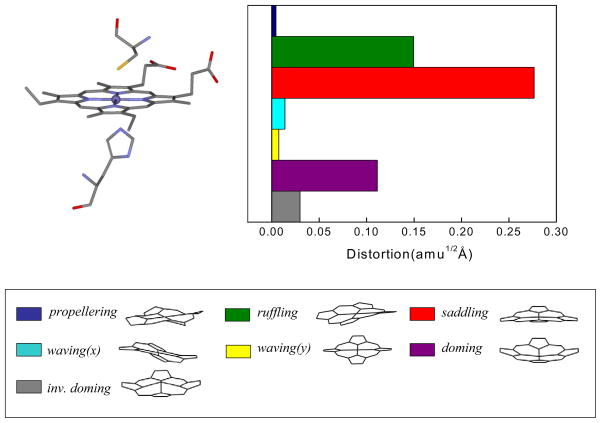
Figure 9.
Crystal structures and NSD analysis of the heme in ferric CBS at pH 8.0. The displacements along each of the low frequency normal mode unit vectors is given in mass weighted coordinates (amu1/2 Å) of the Fe and 24 porphyrin (4N, 20C) atoms. The color coding for the modes is pro: propellering (blue), ruf: ruffling (green), sad: saddling (red), wav(x): wavingx (light blue), wav(y): wavingy (yellow), dom: doming (purple), invdom: inverse doming (gray). The minus sign of displacement is defined only for doming and inverse doming to indicate the direction of Fe displacement (+: proximal; −: distal). The crystal sctucture comes from the protein data bank (PDB) 1M5416. The NSD analysis shows a strong heme saddling distortion, which is consistent with the appearance of the ~90 cm−1(γc) mode in the coherence spectra of ferric CBS at pH 8.

