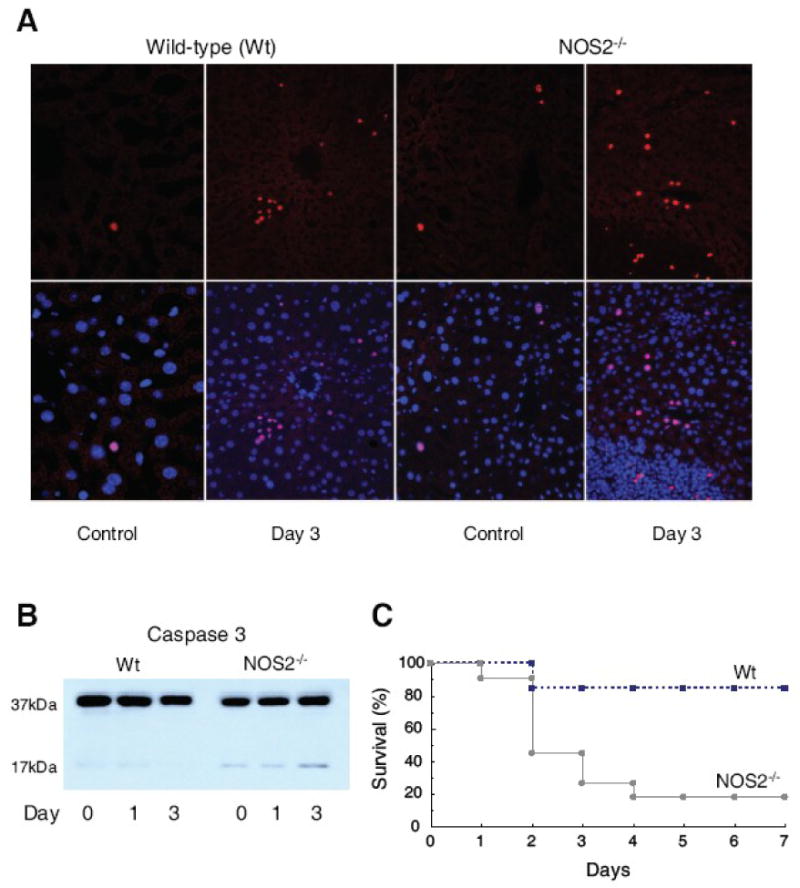
Figure 1. Hepatic apoptosis and survival after live E. coli peritonitis in mice.

E. coli inoculation is 1× 10⁷ CFU. Fig. 1A shows TUNEL staining of liver sections of Wt and NOS2-/- mice pre and 3 days post fibrin clot implantation. Top row, Wt mice showed occasional scattered small clusters and independent TUNEL-positive cell nuclei (red), while NOS2-/- mice show many stained nuclei throughout. Bottom images show TUNEL merger with DAPI nuclear staining. Fig. 1B: NOS2-/- mice showed greater hepatic cleavage of caspase-3 than Wt mice. Fig. 1C: NOS2-/- mice have a higher 7-day mortality than Wt mice (P<0.05).
