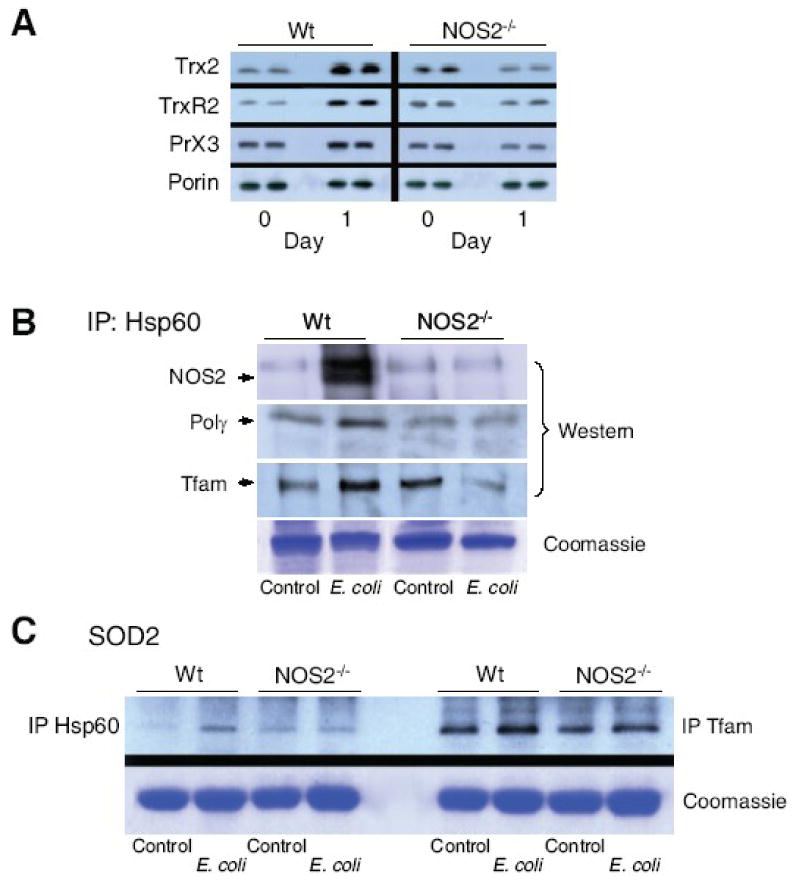
Figure 7. Mitochondrial Hsp60 interactions with Tfam and Polγ protein.

Fig. 7A: Hepatic Hsp60 total/mitochondrial ratio at day 0, and day 1 and 3 after E. coli peritonitis for both lines of mice. Hsp60 was stable in mitochondria relative to porin and total Hsp60 in the extracts. Fig. 7B: Mitochondrial antioxidant, anti-apoptotic proteins, thioredoxin-2 (Trx2), thioredoxin reductase-2 (TrxR2), and peroxiredoxin-3 (Prx3) increased by Western analysis in Wt mice but failed to respond in NOS2-/- mice (* P<0.05 vs. baseline; † P<0.05 vs. baseline and vs. NOS2-/-). In Fig. 7C, NOS2 protein was not detectable in mitochondria pre-challenge, but co-precipitated with mitochondrial Hsp60 at day 1 post E.coli (top gel). Hsp60 co-precipitated with Tfam and Polγ before, but more strongly at 1 day post challenge in Wt mice. In NOS2-/- mice, the Hsp60 association was unchanged or declined after challenge (second and third gels). Fig. 7D: In contrast, in both lines of mice, mitochondrial Hsp60 co-precipitated weakly with SOD2 (left 4 lanes), while SOD2 co-precipitated strongly with Tfam before and after challenge (right 4 lanes).
