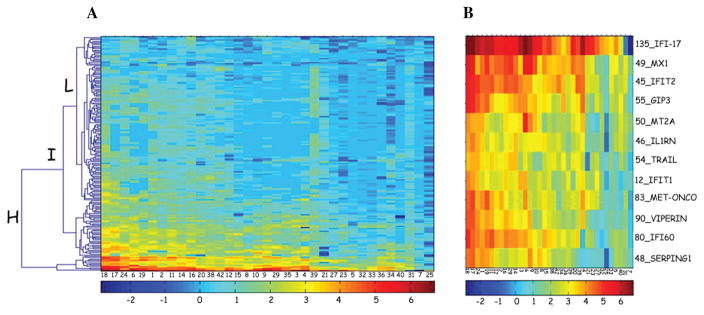
Figure 3.
ISG expression patterns in MS patients. (A) The figure shows a heat map of the ISG fold-induction intensity for 35 patients at baseline. Patients are represented by columns and genes across the rows. The colors range from low induction ratios in blue, to high induction ratios in red. As is evident, the 35 subjects range from high ISG inducers on the left, to low ISG inducers on the right. The heat map illustrates qualitative and quantitative variability in ISG induction across the 35 patients. The ISGs induced in the patients blood after IFN-β injection at baseline can be clustered into three groups as high expression (H), intermediate expression (I) and low expression (L) cluster. (B) Expanded view of the high expression cluster shown in the heat map in Figure 3A.

