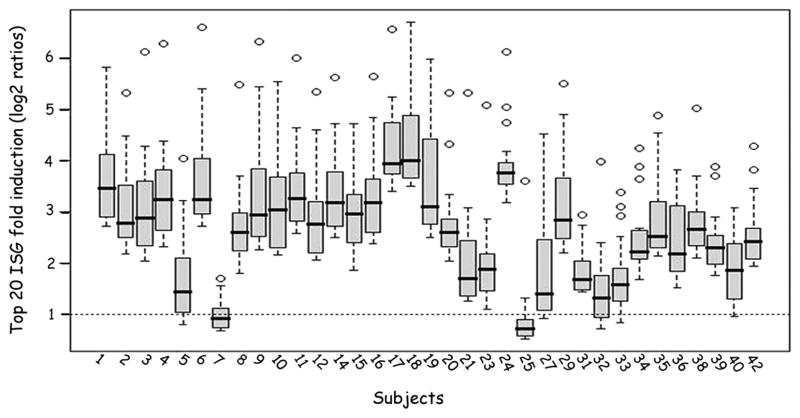
Figure 5.
Quantitative variability across patients in the magnitude of ISG induction. The figure illustrates the fold-induction of top 20 ISGs for all 35 patients at baseline. This figure shows box and whisker plots for each of the 35 subjects and represents the fold-induction on a log scale for the top 20 genes induced in each subject. All but two subjects (7 and 25) induced numerous genes, but with considerable variability across the subject pool. The figure illustrates the quantitative variability across patients in the magnitude of ISG induction.

