
Fig. (1).
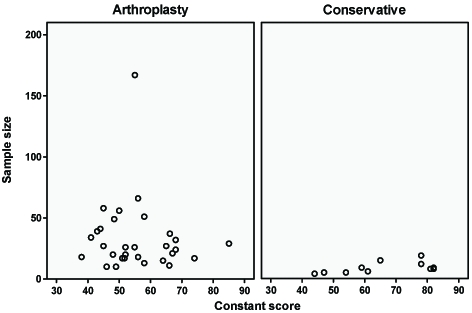
Funnel plot of Constant scores by sample size of the arthroplasty group in 30 patient groups (mean Constant score = 55.5) and of the conservative group in 11 patient groups (mean Constant score = 66.5).
Official websites use .gov
A
.gov website belongs to an official
government organization in the United States.
Secure .gov websites use HTTPS
A lock (
) or https:// means you've safely
connected to the .gov website. Share sensitive
information only on official, secure websites.
Funnel plot of Constant scores by sample size of the arthroplasty group in 30 patient groups (mean Constant score = 55.5) and of the conservative group in 11 patient groups (mean Constant score = 66.5).