
Fig. (1).
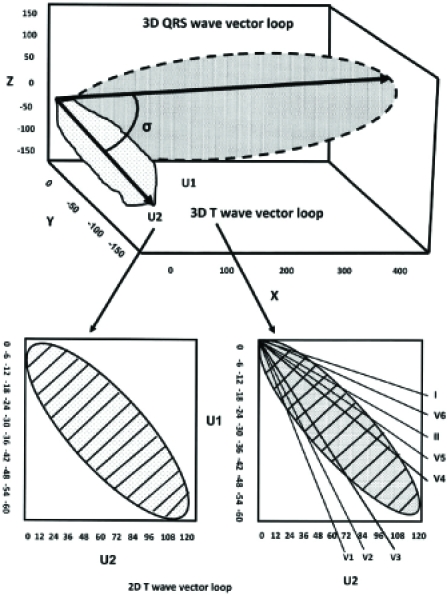
A schematic 3-dimensional view of the QRS and T-wave vector loops. The main vectors of the 2 loops are depicted by arrows and the angle between them is shown (spatial QRS-T angle). Bottom left, the T-wave loop is shown in a 2-dimensional plane with the unipolar axes U1 and U2 and is divided into marked subdivisions. In this plane a hypothetical rectangle encompasses the T-wave loop and is theoretically divided into 100 subdivisions. The T-wave loop dispersion is expressed by the number of the subdivisions that it passes. In this example, the T-wave loop dispersion is 35. The T-wave amplitude is calculated as a fraction of the encompassing rectangle and it is marked by stripes. Bottom right, the reconstruction of the T-wave loop from the vectors of the classical 12-ECG leads. The T-wave morphology dispersion is calculated by the averaging angle between all possible reconstruction vector pairs.