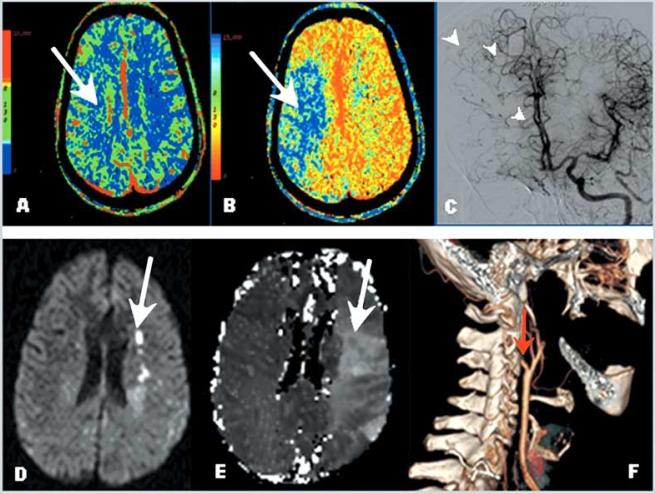
Fig. (5). Cerebral perfusion studies: Computed Tomography and Magnetic Resonance Imaging.
Panel A. Cerebral Blood Volume (CBV) demonstrates normal values. Panel B. Prolonged mean transit time (MTT) demonstrates hypoperfusion of the right hemisphere in the middle cerebral artery territory. Comparison of the CBV and MTT images reveals a mismatch, consistent with a region of ischemic penumbra. Panel C. Cerebral angiogram in the same patient showing collateral flow to the right anterior cerebral artery territory through the anterior communicating artery and leptomeningeal collaterals (arrow heads). Panels D, E and F. Example of diffusion weighted images (DWI) and perfusion weighted images (PWI) in a patient with carotid artery occlusion. Note small areas of restricted diffusion in Panel D (acute infarcts-bright signal) compared with a large area of decreased perfusion in Panel E (arrow), demonstrating a region of mismatch (ischemic penumbra). Panel F shows a three dimensional reconstruction of the carotid system based on CT angiography, demonstrating occlusion of the internal carotid artery at the origin (red arrow).

